A tool used to manage a processed sonar log. Learn how to use the different options and menus available in the BioBase trip viewer.
The BioBase trip viewer displays an interactive view of reports processed by BioBase EcoSound.
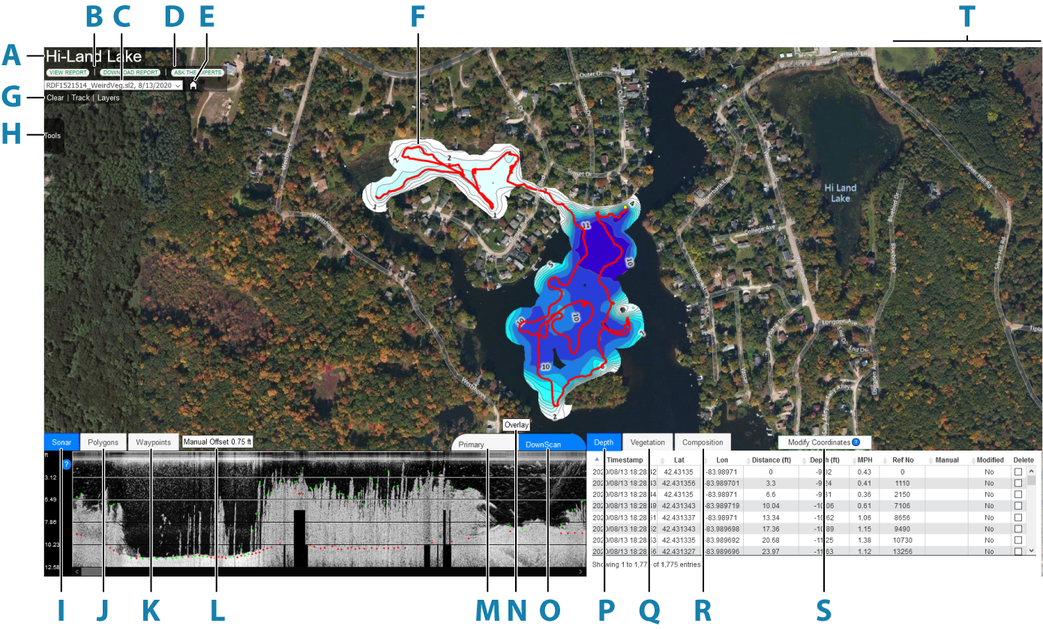
| A |
Waterbody Name Section
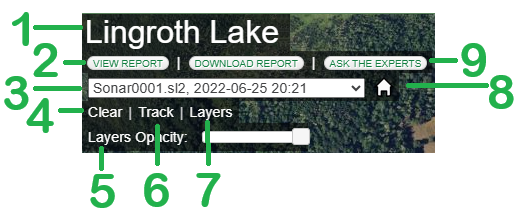
1. Waterbody Name
A name assigned to the bodies of water where the trip has been recorded. The waterbody name is automatically displayed according to the names displayed in Bing Maps. If there is no name displayed, or it is wrong, then the user should use the "Ask the Experts" button to send the proper name of the lake or pond. |
|
2. Report buttons
View report – used to generate the EcoSound summary report as static html stored on BioBase servers. This link can be shared with others and recipients will not have access to any other content in the senders BioBase account.. Download report – used to download the HTML EcoSound summary report. For more information, refer to the Processing sonar/echosounder log files section described in this manual. |
|
|
3. Trip list
If the displayed waterbody has more trips associated with it, they can be selected from the list to display the trip in the BioBase trip viewer. |
|
|
4. Clear
This will open a Clear menu to Clear all images or Contours or the currently displayed layer. |
|
|
5. Layers Opacity
This tool will change the transparency of the currently displayed layer. |
|
|
6. Track
Click this button to turn off or on the red track line on the map display. |
|
|
7. Layers
Includes buttons used to manage the displayed overlays. Refer to Managing the displayed overlays section described in this manual. |
|
|
8. Home (house) Icon
Access to the BioBase Dashboard. |
|
|
9. Ask the Experts
Used to report any issue or ask any questions about a selected trip. Refer to Quality control section described in this manual. |
|
| B |
Tools button
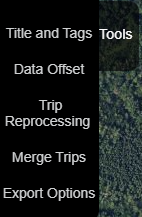 Used to access the toolbar. Displays the list of options used to manage the processed data. |
| C |
Sonar Tab and Tools
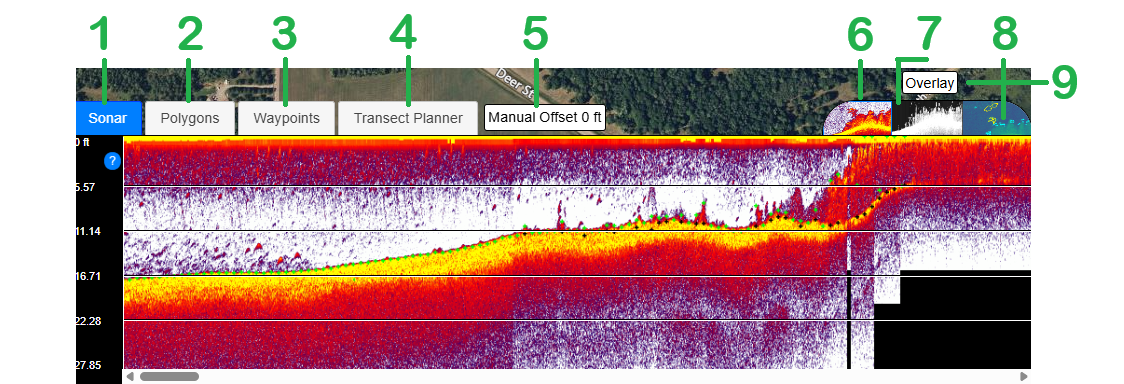
1. Sonar
Displays the georeferenced sonar/echosounder image. |
|
2. Polygons Tab
Used to access the GIS Polygon tool. |
|
|
3. Waypoints Tab
Used to access the Waypoint tool to list, upload, and download. |
|
|
4. Transect Planner
Use the Transect Planner to do an efficient survey of the waterbody. |
|
|
5. Manual Offset
Displays the number of manually added offset depth used in the calculation. |
|
|
6. Primary Tab
Displays the traditional sonar/echosounder image. |
|
|
7. DownScan Tab
Displays the available DownScan image. |
|
|
8. EcoFish Tab
Displays the fish target images from the sonar log. |
|
|
9. Overlay
A processing preference that allows the user to overlay vegetation height (green) and depth (red - downscan or blue - primary) on the top of the sonar image. The overlay will only show on the channel processed for vegetation. |
|
| D |
GPS Coordinated Data
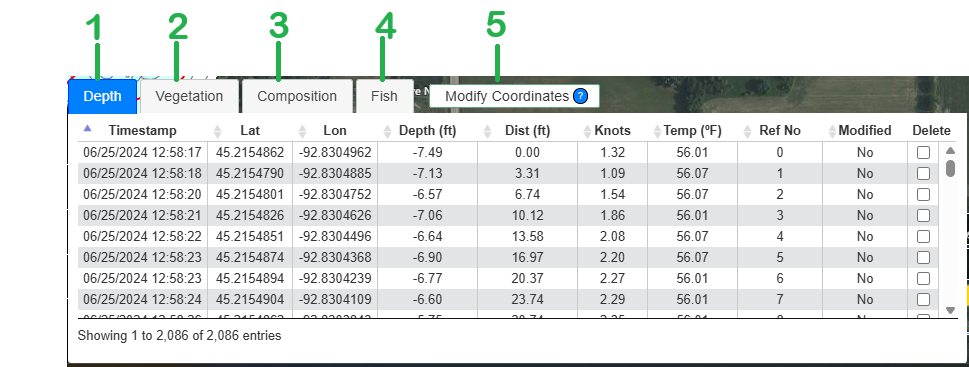
1. Depth Tab
Indicates the depth of the associated GPS coordinate data. |
|
2. Vegetation Tab
Indicates the percentage biovolume of the associated GPS coordinate data. |
|
|
3. Composition Tab
This indicates the bottom hardness of the associated GPS coordinate data. |
|
|
4. Fish Tab
Indicates the number of fish targets of the associated GPS coordinate data. |
|
|
5. Modify Coordinates
Select a range of coordinates for each layer to delete or delete and replace with user-specified values. Press and hold Shift then click and drag a box around a track to bulk delete all coordinates along the track. |
|
| E |
Map Overlay Tools
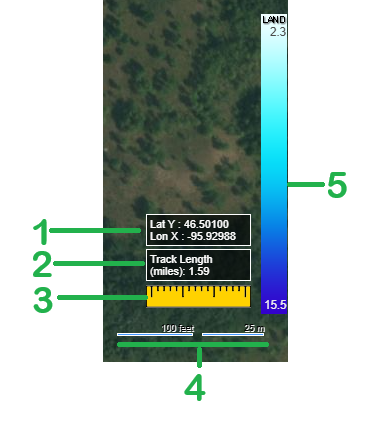
1. Lat Y and Lon X
Shows the, Lat Y and Lon X, location of the mouse arrow on the map. |
|
2. Track Length
The length of the red Track line for the displayed trip. |
|
|
3. Measuring Tool
Use this to take measurements on the map. |
|
|
4. Scale Reference
The scale changes as the map is zoomed in or out accordingly. |
|
|
5. Color Legend
The legend shows Depth, Vegetation, Composition, and Fish Abundance values and colors that match the displayed layer. |
|
| F |
Notifications Area
 |
|
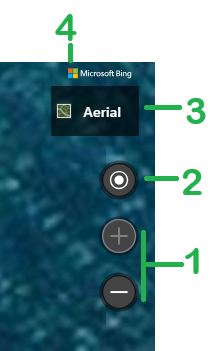
1. Zoom Buttons
The length of the red Track line for the displayed trip. |
|
|
2. Center Button
Clicking this button will move to the map to the location indicated by the web browser.
|
|
|
3. Map Type View
Click on this button to show the map view menu options. The Default view is Aerial, and Road Map View is the other available options. Label display can also be turned off or on this menu. |
|
|
4. Notification Display
Displays any notifications that may not require acknowledgment. It is recommended to pay attention to the importance and occurrence of the notifications. |
|
| G |
Waterbody Layers
 |
|
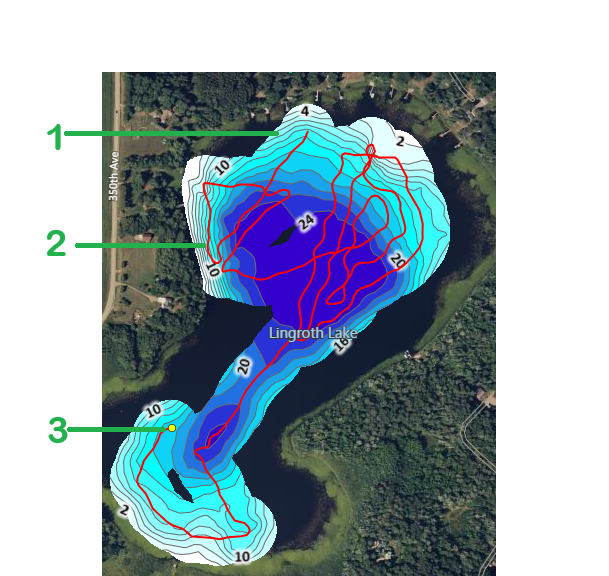
1. Graphic Layer
Display of the current selected layer, contour depth lines and labels. |
|
|
2. Track Line
The path of the sonar trip. |
|
|
3. Location Indicator
Will display in the Sonar Viewer and the corresponding data where in the trip it is located. |