The georeferenced sonar/echosounder image displayed in the BioBase trip viewer is based on the log file you selected. The image displayed is matched with the trip path and the precise area on the sonar/echosounder log where the data were derived.
Sonar Viewer
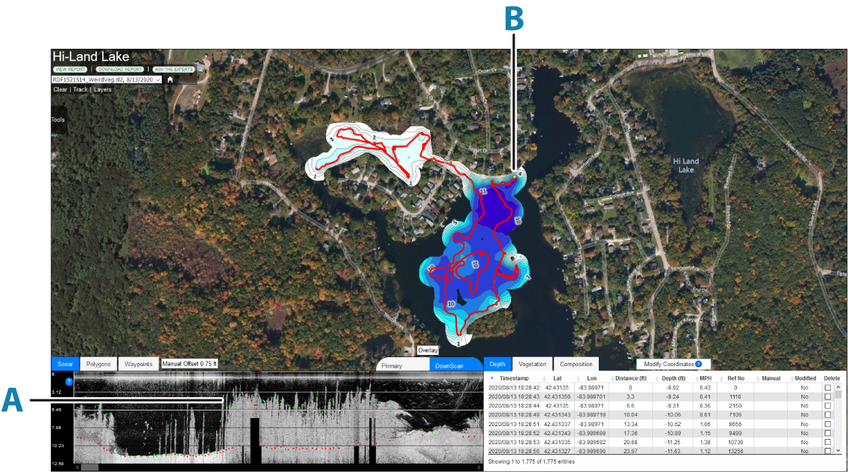
When you select an area on the displayed sonar/echosounder image, it is presented with a vertical line (A). This line is positioned according to the location of the yellow dot displayed on the track (B).
Selecting an image to display
You can change the views between different sonar/echosounder images available in the Sonar tab. The available image views are depending on the selected trip.
-
Primary
By default, the primary or the traditional sonar/echosounder image available on the selected trip is displayed in the Sonar tab.
Note: The merged trips will not have any sonar/echosounder image associated to it. -
DownScan
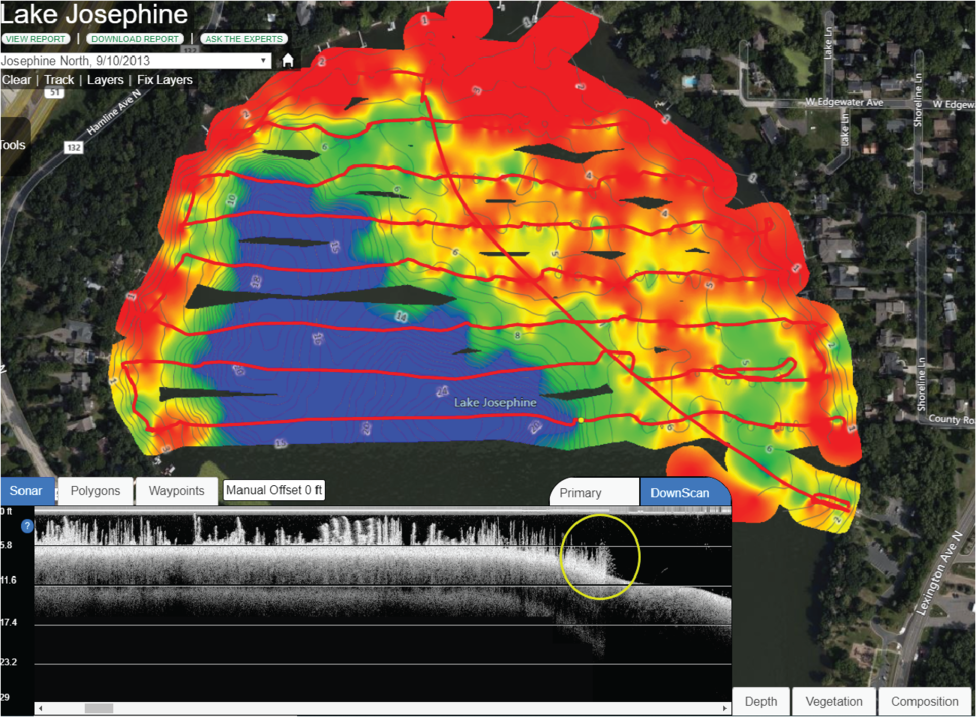
The DownScan image will be viewable if the selected log file has a DownScan data associated to it.
The image shown below is an example of a DownScan image associated to a selected trip. Notice the high detail of plant images and fish targets at the edge of the vegetation bed.
-
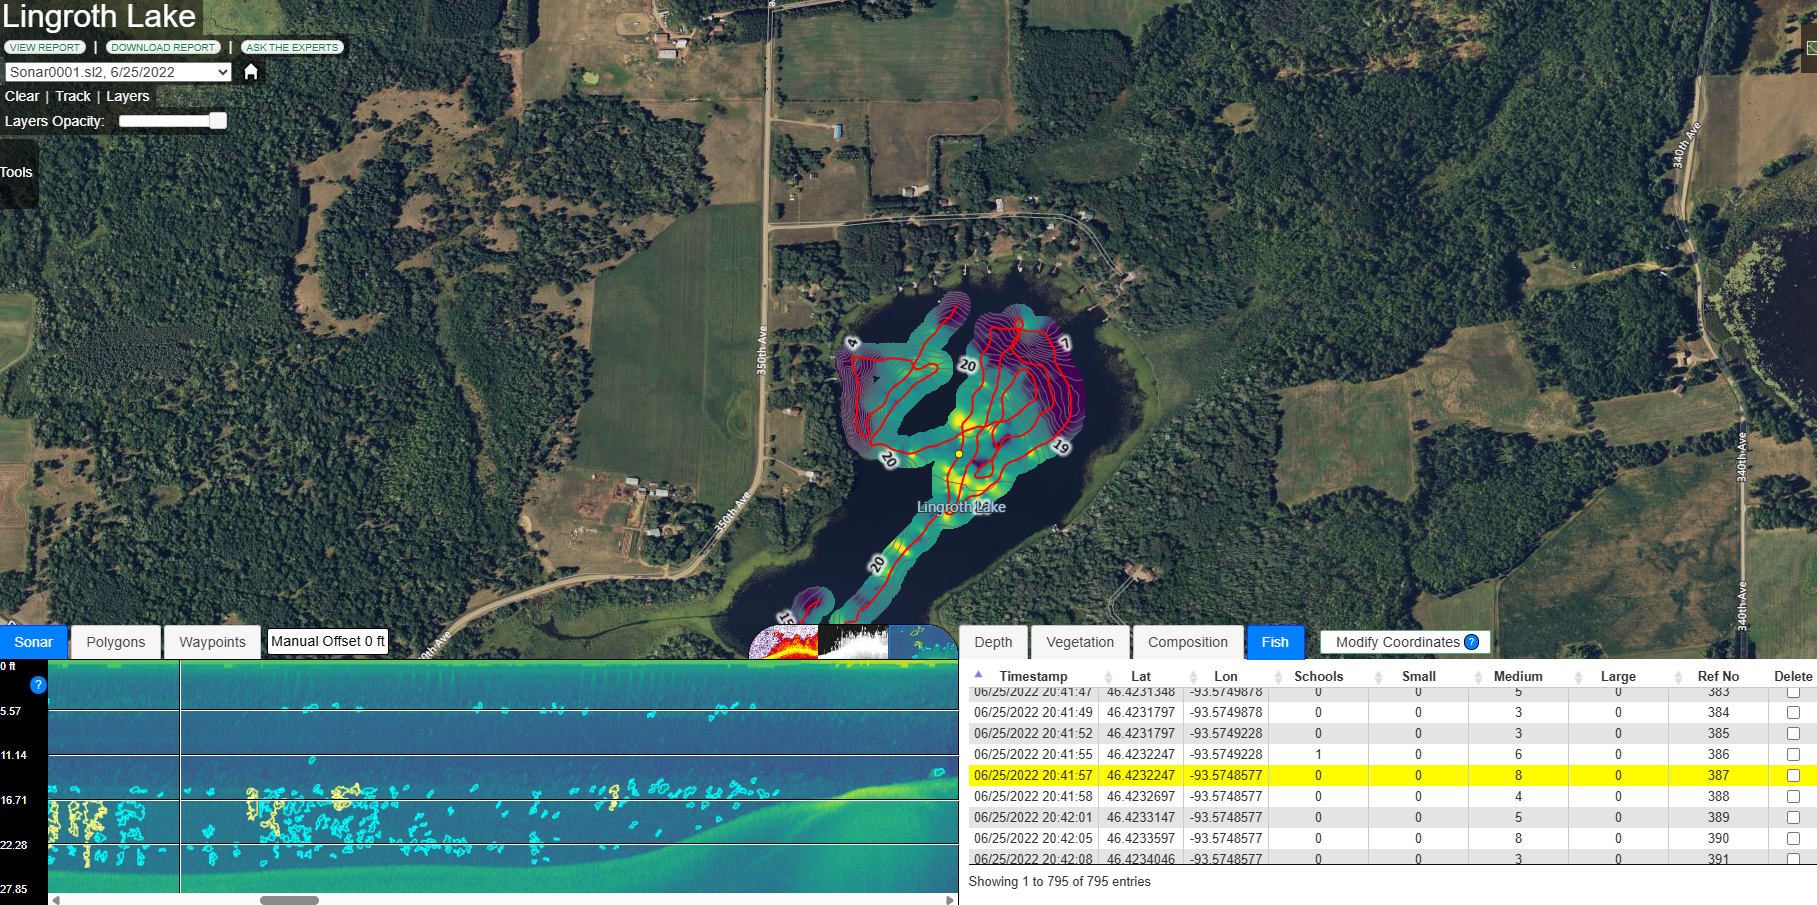
EcoFish
The EcoFish image will be if the selected trip has the EcoFish option assigned to the trip. Looking at the image below you will see fish targets outlined in blue and schools of fish outlined in yellow.