Select Vegetation from the Layers dialog to view the vegetation/biovolume heat mapping.
Vegetation overlay shows the plant height data that is rendered as the average proportion of plant height to water depth (% biovolume) in a collection of pings for a GPS coordinate point (typically 5 to 30 signals per GPS point and GPS point every second).
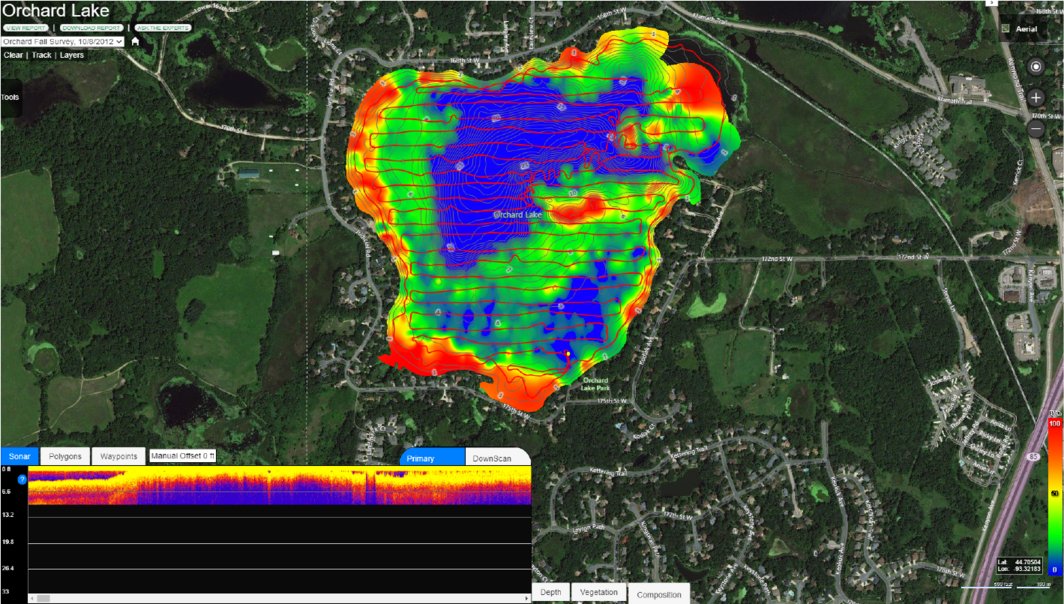
Use the legend below to determine the differences between the colors presented in the biovolume heat mapping:
| Colors | Representations |
|---|---|
| Red | Signals are automatically interpreted as surface aquatic plant growth (e.g. biovolume = 100%) |
| Blue | If aquatic plant length for a collection of pings is less than 5% on average, then this is within the margin of detection error and biovolume is set to zero by default. |
| Green/yellow | Represent intermediate subsurface vegetation growth. |
Note: If the
signal does not meet certain minimum requirements (e.g., too shallow or
fast), a map output will not be produced and no data will be highlighted
in the attribute table for the layer of interest (often the case if you
travel for long periods of depths < 2.4 ft)